深圳幻海软件技术有限公司 欢迎您!

【云原生】Grafana 介绍与实战操作

2023-03-28

一、概述grafana是用于可视化大型测量数据的开源程序,他提供了强大和优雅的方式去创建、共享、浏览数据。dashboard中显示了你不同metric数据源中的数据。grafana最常用于因特网基础设施和应用分析,但在其他领域也有机会用到,比如:工业传感器、家庭自动化、过程控制等等。grafana有

一、概述

grafana是用于可视化大型测量数据的开源程序,他提供了强大和优雅的方式去创建、共享、浏览数据。dashboard中显示了你不同metric数据源中的数据。

  • grafana最常用于因特网基础设施和应用分析,但在其他领域也有机会用到,比如:工业传感器、家庭自动化、过程控制等等。
  • grafana有热插拔控制面板和可扩展的数据源,目前已经支持Graphite、InfluxDB、OpenTSDB、Elasticsearch。
  • grafana 高版本也支持告警功能,支持各种告警通道:webhook,alertmanager、mail、钉钉等等。
  • 每一个数据源的查询语言和能力都是不一样的。你能够把来自多个数据源的数据组合到一个仪表板,但每个面板被绑定到一个特定的数据源,它就属于一个特定的组织。

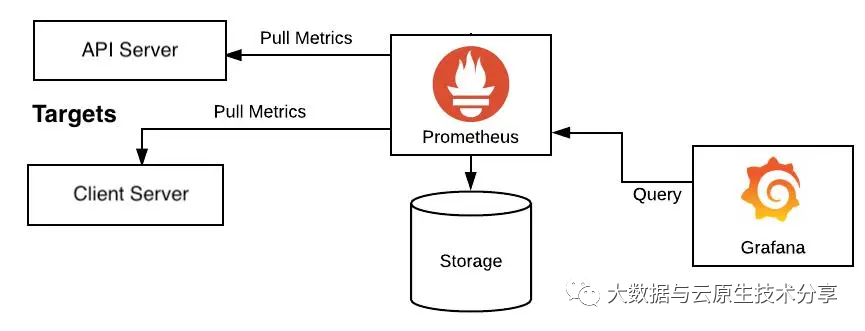
一般是Prometheus与Grafana配套使用,有些公司直接使用Grafana告警,而弃用alertmanager。相关参考文档如下:

  • Grafana官方文档:https://grafana.com/docs/grafana/latest/
  • Grafana GitHub地址:https://github.com/grafana/grafana
  • Prometheus原理详解
  • 【云原生】Prometheus Pushgetway讲解与实战操作
  • 【云原生】Prometheus AlertManager讲解与实战操作
  • 【云原生】Prometheus PromQL讲解与实战操作
  • 【云原生】Prometheus 自定义告警规则

二、Grafana 安装

1)下载安装

下载地址:https://grafana.com/grafana/download?platform=linux

wget https://dl.grafana.com/enterprise/release/grafana-enterprise-9.3.2-1.x86_64.rpm
sudo yum install grafana-enterprise-9.3.2-1.x86_64.rpm -y
  • 1.
  • 2.

2)安装包信息

  • 二进制文件: /usr/sbin/grafana-server
  • init.d 脚本: /etc/init.d/grafana-server
  • 环境变量文件: /etc/sysconfig/grafana-server
  • 配置文件: /etc/grafana/grafana.ini
  • 启动项: /usr/lib/systemd/system/grafana-server.service
  • 日志文件:/var/log/grafana/grafana.log
  • 默认配置的sqlite3数据库:/var/lib/grafana/grafana.db
  • grafana 默认插件的存放位置:/var/lib/grafana/plugins

3)启动服务

sudo systemctl daemon-reload
sudo systemctl start grafana-server
# Grafana 开机自启动
sudo systemctl enable grafana-server
sudo systemctl status grafana-server
# 默认端口 3000
netstat -nlpt|grep 3000
  • 1.
  • 2.
  • 3.
  • 4.
  • 5.
  • 6.
  • 7.

4)Grafana 访问

默认端口是3000​,访问地址:http://IP:3000​默认账号/密码:admin/admin

三、Grafana 功能介绍

  • Data Source(数据源):Grafana支持多种不同的时序数据库数据源,Grafana对每种数据源提供不同的查询方法,而且能很好的支持每种数据源的特性。官方地址:https://grafana.com/docs/grafana/latest/datasources/

  • DashBoard:仪表盘,就像汽车仪表盘同样能够展现不少信息,包括车速,水箱温度等。Grafana的DashBoard就是以各类图形的方式来展现从Datasource拿到的数据。https://grafana.com/grafana/dashboards/
  • Row:行,DashBoard的基本组成单元,一个DashBoard能够包含不少个row。一个row能够展现一种信息或者多种信息的组合,好比系统内存使用率,CPU五分钟及十分钟平均负载等。因此在一个DashBoard上能够集中展现不少内容。
  • Panel:面板,实际上就是row展现信息的方式,支持表格(table),列表(alert list),热图(Heatmap)等多种方式,具体能够去官网上查阅。
  • Query Editor​:查询编辑器,用来指定获取哪一部分数据。相似于sql查询语句,好比你要在某个row里面展现test这张表的数据,那么Query Editor里面就能够写成select *from test。这只是一种比方,实际上每一个DataSource获取数据的方式都不同,因此写法也不同(https://grafana.com/docs/grafana/latest/datasources/),好比像zabbix,数据是以指定某个监控项的方式来获取的。
  • Organization:组织,org是一个很大的概念,每一个用户能够拥有多个org,grafana有一个默认的main org。用户登陆后能够在不一样的org之间切换,前提是该用户拥有多个org。不一样的org之间彻底不同,包括datasource,dashboard等都不同。建立一个org就至关于开了一个全新的视图,全部的datasource,dashboard等都要再从新开始建立。
  • User:用户,这个概念应该很简单,不用多说。Grafana里面用户有三种角色admin,editor,viewer。admin权限最高,能够执行任何操做,包括建立用户,新增Datasource,建立DashBoard。editor角色不能够建立用户,不能够新增Datasource,能够建立DashBoard。viewer角色仅能够查看DashBoard。在2.1版本及以后新增了一种角色read only editor(只读编辑模式),这种模式容许用户修改DashBoard,可是不容许保存。每一个user能够拥有多个organization。

四、使用mysql存储

1)安装mysql

mysql安装可以参考我下面这篇文章,这里就不再重复讲解了:MySQL高可用实战( MHA)

2)修改grafana配置

1、创建grafana用户和grafana库

# 登录客户端
mysql -uroot -p
密码:123456

# 创建数据库
CREATE DATABASE IF NOT EXISTS grafana default charset utf8 COLLATE utf8_general_ci;

# 创建用户并授权
grant all  on grafana.* to 'grafana'@'192.168.182.%' identified by '123456';
  • 1.
  • 2.
  • 3.
  • 4.
  • 5.
  • 6.
  • 7.
  • 8.
  • 9.

2、修改grafana配置

配置文件: /etc/grafana/grafana.ini

[database]
type = mysql
host = 192.168.182.110:3306
name = grafana
user = grafana
password = 123456
# 也可以直接配置url
# url = mysql://grafana:grafana@192.168.182.110:3306/grafana
  • 1.
  • 2.
  • 3.
  • 4.
  • 5.
  • 6.
  • 7.
  • 8.

重启grafana

systemctl restart grafana-server
  • 1.

五、配置数据源(Data sources)

1)配置prometheus 数据源

前面我们已经部署了prometheus了,所以可以把prometheus数据源加进来。

2)配置mysql 数据源

六、配置监控面板(Dashboard)

地址:https://grafana.com/grafana/dashboards/

1)node_exporter 监控面板

1、安装node_exporter

下载地址:https://github.com/prometheus/node_exporter/releases/

【1】下载

wget https://github.com/prometheus/node_exporter/releases/download/v1.5.0/node_exporter-1.5.0.linux-amd64.tar.gz
tar -xzf node_exporter-1.5.0.linux-amd64.tar.gz
  • 1.
  • 2.

【2】配置node_exporter.service启动

# 默认端口9100
cat >/usr/lib/systemd/system/node_exporter.service<<EOF
[Unit]
Descriptinotallow=node_exporter
After=network.target
 #可以创建相应的用户和组 启动
#User=prometheus
#Group=prometheus

[Service]
ExecStart=/opt/prometheus/exporter/node_exporter/node_exporter-1.5.0.linux-amd64/node_exporter --web.listen-address=:9100
[Install]
WantedBy=multi-user.target
EOF
  • 1.
  • 2.
  • 3.
  • 4.
  • 5.
  • 6.
  • 7.
  • 8.
  • 9.
  • 10.
  • 11.
  • 12.
  • 13.
  • 14.

【3】启动服务

systemctl daemon-reload
systemctl start node_exporter
systemctl status node_exporter
systemctl enable node_exporter
  • 1.
  • 2.
  • 3.
  • 4.

【4】检查

curl http://localhost:9100/metrics
  • 1.

2、配置Prometheus加载node_exporter

添加或修改配置 prometheus.yml

重新加载

systemctl restart prometheus
# 1、 kill方式
#kill -HUP pid
# 2、curl方式(推荐)
#curl -X POST http://IP/-/reload
# 【注意】需要在启动的命令行增加参数:--web.enable-lifecycle
curl -X POST http://192.168.182.110:9090/-/reload
# 3、重启(不推荐,重启会导致所有的连接短暂性中断)
# systemctl restart prometheus
  • 1.
  • 2.
  • 3.
  • 4.
  • 5.
  • 6.
  • 7.
  • 8.
  • 9.

3、配置监控面板

地址:https://grafana.com/grafana/dashboards/?search=node_exporter

加载有两种方式:离线(json文件)和在线(通过ID远程下载json)

导入之后就可以看到数据了。

2)mysql_exporter 监控面板

下载地址:https://github.com/prometheus/mysqld_exporter

1、安装node_exporter

【1】下载

QQ6MWjh" data-card-editable="false" class="" data-syntax="sql">
# 注意MySQL对应的版本
export VER=0.12.0
wget https://github.com/prometheus/mysqld_exporter/releases/download/v${VER}/mysqld_exporter-${VER}.linux-amd64.tar.gz
tar xvf mysqld_exporter-${VER}.linux-amd64.tar.gz
mv mysqld_exporter-${VER}.linux-amd64/mysqld_exporter /usr/local/bin/
chmod +x /usr/local/bin/mysqld_exporter
  • 1.
  • 2.
  • 3.
  • 4.
  • 5.
  • 6.

【2】配置数据库凭证创建数据库凭证文件,为用户创建添加正确的用户名和密码并设置所有权限:

cat > /root/.my.cnf <<EOF
[client]
host=192.168.182.110
port=3306
user=mha
password=123456
EOF
  • 1.
  • 2.
  • 3.
  • 4.
  • 5.
  • 6.
  • 7.

【3】配置mysql_exporter.service启动

# 默认端口:9104
cat > /etc/systemd/system/mysqld_exporter.service <<EOF
[Unit]
Descriptinotallow=Prometheus MySQL Exporter
After=network.target
#User=prometheus
#Group=prometheus

[Service]
Type=simple
Restart=always
ExecStart=/usr/local/bin/mysqld_exporter \
--config.my-cnf /root/.my.cnf \
--collect.global_status \
--collect.info_schema.innodb_metrics \
--collect.auto_increment.columns \
--collect.info_schema.processlist \
--collect.binlog_size \
--collect.info_schema.tablestats \
--collect.global_variables \
--collect.info_schema.query_response_time \
--collect.info_schema.userstats \
--collect.info_schema.tables \
--collect.perf_schema.tablelocks \
--collect.perf_schema.file_events \
--collect.perf_schema.eventswaits \
--collect.perf_schema.indexiowaits \
--collect.perf_schema.tableiowaits \
--collect.slave_status \
--web.listen-address=0.0.0.0:9104

[Install]
WantedBy=multi-user.target
EOF
  • 1.
  • 2.
  • 3.
  • 4.
  • 5.
  • 6.
  • 7.
  • 8.
  • 9.
  • 10.
  • 11.
  • 12.
  • 13.
  • 14.
  • 15.
  • 16.
  • 17.
  • 18.
  • 19.
  • 20.
  • 21.
  • 22.
  • 23.
  • 24.
  • 25.
  • 26.
  • 27.
  • 28.
  • 29.
  • 30.
  • 31.
  • 32.
  • 33.
  • 34.

【4】启动服务

systemctl daemon-reload
systemctl start mysqld_exporter
systemctl status mysqld_exporter
systemctl enable mysqld_exporter
# 启动并开机自启,等价于上面两行
# systemctl enable --now mysqld_exporter
  • 1.
  • 2.
  • 3.
  • 4.
  • 5.
  • 6.

【5】检查

curl http://localhost:9104/metrics
  • 1.

2、配置Prometheus加载mysql_exporter

添加或修改配置 prometheus.yml

重新加载

systemctl restart prometheus
# 1、 kill方式
#kill -HUP pid
# 2、curl方式(推荐)
#curl -X POST http://IP/-/reload
# 【注意】需要在启动的命令行增加参数:--web.enable-lifecycle
curl -X POST http://192.168.182.110:9090/-/reload
# 3、重启(不推荐,重启会导致所有的连接短暂性中断)
# systemctl restart prometheus
  • 1.
  • 2.
  • 3.
  • 4.
  • 5.
  • 6.
  • 7.
  • 8.
  • 9.

3、配置监控面板

地址:https://grafana.com/grafana/dashboards/7362-mysql-overview/

3)Grafana Query语法

4)自定义监控面板

上面两个是网上提供的面板,其实在生产环境中,很多时候是需要自定义监控项的。

1、Prometheus数据源

【1】新建一个空面板

  • Panel:面板,实际上就是row展现信息的方式,支持表格(table),列表(alert list),热图(Heatmap)等多种方式,具体能够去官网上查阅。
  • Row:行,DashBoard的基本组成单元,一个DashBoard能够包含不少个row。一个row能够展现一种信息或者多种信息的组合,好比系统内存使用率,CPU五分钟及十分钟平均负载等。因此在一个DashBoard上能够集中展现不少内容。
【2】编写PromQL表达式

选择Prometheus数据源并且选择Query​ 就可以直接写 PromQL。先在Prometheus上调试promql,在粘贴过来就行了。

# 内存使用率
100 - ((node_memory_MemAvailable_bytes{instance="192.168.182.110:9100",job="prometheus"} * 100) / node_memory_MemTotal_bytes{instance="192.168.182.110:9100",job="prometheus"})
  • 1.
  • 2.

上面只显示一个机器的内存,显然还不完善,如果想显示多个,可以这样表达:

# 把instance="192.168.182.110:9100"去掉
100 - ((node_memory_MemAvailable_bytes{job="prometheus"} * 100) / node_memory_MemTotal_bytes{job="prometheus"})

# 或者复制几份
100 - ((node_memory_MemAvailable_bytes{instance="192.168.182.110:9100",job="prometheus"} * 100) / node_memory_MemTotal_bytes{instance="192.168.182.110:9100",job="prometheus"})
100 - ((node_memory_MemAvailable_bytes{instance="192.168.182.111:9100",job="prometheus"} * 100) / node_memory_MemTotal_bytes{instance="192.168.182.111:9100",job="prometheus"})
100 - ((node_memory_MemAvailable_bytes{instance="192.168.182.112:9100",job="prometheus"} * 100) / node_memory_MemTotal_bytes{instance="192.168.182.112:9100",job="prometheus"})
  • 1.
  • 2.
  • 3.
  • 4.
  • 5.
  • 6.
  • 7.
【3】变量使用

显然上面的方式不太好,这里使用变量的方式动态获取实例个数。先来了解Grafana的几个函数:

函数

作用

label_values(label)

返回Promthues所有监控指标中,标签名为label的所有可选值。

label_values(metric, label)

返回Promthues所有监控指标metric中,标签名为label的所有可选值。

metrics(metric)

返回所有指标名称满足metric定义正则表达式的指标名称

query_result(query)

返回prometheus查询语句的查询结果

参数解释:1、instance

  • type​:变量类型,变量类型有多种,其中Query表示这个变量是一个查询语句,type可以是Custom自定义,type也可以是Data source,Data source就表示该变量代表一个数据源,如果是datasource你可以用该变量修改整个DashBoard的数据源,变量类型还可以是时间间隔Interval等等。这里我们选择Query。

2、General

  • Name:变量名,比如我这里取名为ip,到时候要使用这个变量名就用$ip来调用。
  • Label:是对应下拉框的名称,默认就是变量名,选择默认即可。
  • Description:描述。

3、Query options

  • Data source:数据源,不用多说。
  • Query:查询表达式,不同的数据源查询表达式都不同。
  • Regex:正则表达式,用来对抓取到的数据进行过滤,这里默认不过滤。
  • Sort:排序,对下拉框中的变量值做排序,排序的方式挺多的,默认是disable,表示查询结果是怎样下拉框就怎样显示。此处选disable。
  • Refresh​: 何时去更新变量的值,变量的值是通过查询数据源获取到的,但是数据源本身也会发生变化,所以要时不时的去更新变量的值,这样数据源的改变才会在变量对应的下拉框中显示出来。Refresh有两个值可以选择。On Dashboard Load:在DashBoard加载时更新。On Time Range Change:在时间范围变化时更新。此处,选择On Dashboard Load,当数据源发生更新是,刷新一下当前DashBoard,变量的值也会跟着发生更新。

4、Selection Options

  • Multi-value:启用这个功能,变量的值就可以选择多个,具体表现在变量对应的下拉框中可以选多个值的组合。
  • Include All option:启用这个功能,变量下拉框中就多了一个all选项。
  • Custom all value:启用Include All option这个功能,才会出现Custom all value这个输入框,表示给all这个选项自定义一个值,all这个选项默认是所有值的组合,你也可以自定义。

【温馨提示】虽然选择组合值可以在一个panel里面查看多种监控数据,但是由于不同监控数据的数值大小格式都可能不一样,在一个图形里面格式很难兼容,这样就会出现问题,所以此处建议默认都不选。

修改表达如下:

100 - ((node_memory_MemAvailable_bytes{instance="$instance",job="prometheus"} * 100) / node_memory_MemTotal_bytes{instance="$instance",job="prometheus"})
  • 1.

2、MySQL数据源

可以直接写sql,直接以表格的形式展现,非常的方便的,像在大数据领域sql是使用最频繁的,所以使用这种直接sql的方式显示图表监控情况还是非常方便的。